Among other places I went to Peru and saw Machu Picchu! The trip back home though was long and boring. There’s lots of ways that one can keep their mind when busy when in a non-stimulating situation though. Reading, Sudoku , cross word puzzles, so on. Sometimes I like playing with code during these times. I had started off reading a math heave book though. I generally have a notebook with me, and my notebooks are generally graph ruled. But graphing polynomials can be tedious. But hey, I had a Chromebook with me, plenty of battery life, and no Internet access. So I decided to see what I could do with the HTML canvas. I cam up with something that worked and was useful. It’s not something that I would package and call a library by any means. After all, this is something that was put together during a layover in an airport. But nonetheless I thought it to be something that is worthy of sharing.
Drawing with the Canvas
Let’s review how to draw with the HTML5 canvas. First a <canvas> element would need to be declared within a page. Within the page’s script we grab a reference to the canvas and get the 2d context and hold onto it; the context object will be the object used for most of our interaction with the canvas. Here I take a canvas
and draw a red rectangle in it.
<canvas id="myCanvas" width="320" height="200"></canvas>

    var canvas = document.getElementById('myCanvas');
    var ctx = canvas.getContext('2d');
    ctx.fillStyle="#FF0000";
	ctx.fillRect(10,10,100,100);
Cool, we can draw on the surface. But before graphing anything we need to be able to map the data that we are graphing to the coordinate space for the graph. That’s going to be a linear transformation. Linear transformations are easy but something that I’m sure I’ll want to do several times. So I’ve made a class to figure out the the transformation for me.
Linear Transformation
Given a pair of starting and ending values this class is able to convert from on value range to another. The class has two methods. the map() method will do the conversion and rmap will perform a reverse conversion. Given the the freezing and boiling points of water in Farenheit and Celcius it could perform conversions back and forth between the two.
function linearMapping(iMin, iMax, oMin, oMax) {
	this.slope =  (oMax - oMin) / (iMax - iMin);
	this.base = oMin - this.slope*iMin;
	this.map = function(x) {
		if(typeof x != 'number')
			return null;
		return x*this.slope+this.base;
	}
	this.rmap = function(x) {
		if(typeof x != 'number')
			return null;
		return (x - this.base)/this.slope;
	}
}
I sat for a while and I thought about the parameters that I would want to pass when creating a graph. I first envisioned passing this information as individual parameters to a function. But I didn’t have to think for long before I realized this would be a lot of parameters most of which I probably would not feel like specifying. I took a slightly different approach and decided to instead pass a parameter object. The object would be initialized with a set of workable default values that could be changed as the graph needed to be customized.
Graphing Options
Some of the basic information needed is the the size of the graph within the HTML page and the ranges of the X and Y values being displayed. I allow these values to be optionally passed in when constructing the object. I’ve also defined a color palette to be used for the graph.
function graphOptions(width, height, minX, maxX, minY, maxY) {
	this.width = width || 300;
	this.height = height || 300;
	this.minX = minX || -10;
	this.maxX = maxX ||  10;
	this.minY = minY || -10;
	this.maxY = maxY ||  10;
	this.stepX = 2;
	this.stepY = 2;
	this.backgroundColor = '#F0F0F0';
	this.lineColor = '#C0C0FF'
	this.minorLineWidth = 1;
	this.majorLineWidth = 4;
	this.dataColors = [
		"#000000",
		"#ff0000",
		"#00ff00",
		"#0000FF",
		"#FF8000",
		"#ff0080",
		"#80FF00",
		"#8000FF"
	]
}
With that we are ready to start creating our graph. We need a way of specifying where in the page the graph should be generated. I’ve made a method named makeGraph() that will accept two arguments; the parent element for the graph and the parameter object for the graph options. If for some reason the parent element isn’t specified the function will just append the graph to the page’s DOM.
Creating the Graph
This class will take care of creating the canvas object. The canvas’s context will be retained along with the options and packaged in an object as both will be needed later for plotting graphs. When the graph is created I render the graph lines on it. The canvas object is added to the page
function makeGraph(parentElement, options) {
	options = options || new graphOptions();
	var graphElement = document.createElement('canvas');

	graphElement.width = options.width;
	graphElement.height = options.height;

	var ctx = graphElement.getContext('2d');
	var newGraph = new graph(ctx, options);
	ctx.fillStyle=options.backgroundColor;
	ctx.fillRect(0,0,options.width, options.height);

	ctx.strokeStyle = options.lineColor;
	ctx.beginPath();
	ctx.lineWidth = options.majorLineWidth;
	var xOrigin = newGraph.xMapping.map(0);
	var yOrigin = newGraph.yMapping.map(0);
	ctx.moveTo(xOrigin,0);
	ctx.lineTo(xOrigin, options.height);
	ctx.moveTo(0, yOrigin);
	ctx.lineTo(options.width, yOrigin)
	ctx.stroke();
	ctx.strokeStyle = options.lineColor;
	ctx.beginPath();
	for(var i = options.minX; i<options.maxX;i+=options.stepX) {
		var xPos = newGraph.xMapping.map(i);
		ctx.moveTo(xPos,0);
		ctx.lineTo(xPos,options.height);
		ctx.lineWidth = options.minorLineWidth;
	}
	for(var i = options.minY; i<options.maxY;i+=options.stepY) {
		var yPos = newGraph.yMapping.map(i);
		ctx.moveTo(0, yPos);
		ctx.lineTo(options.width, yPos);
		ctx.lineWidth = options.minorLineWidth;
	}
	ctx.stroke();

	if(parentElement != null)
		parentElement.appendChild(graphElement)
	else
		document.body.appendChild(graphElement)
	return newGraph;
}
The result of the above is the return of a graph object that hasn’t been defined here yet. The graph object packages together the context for rendering, the graph objects, and the objects for mapping the values being represented to canvas coordinates. Something that may look odd at first is that for the Y-mapping I placed a maximum value in a minimum parameter and vice versa. This is because the coordinate system that many of us use when thinking about graphs is reversed along the Y-axis than the canvas coordinates. The general way that people think about graphs is that numbers of greater value will appear higher up on the graph. But in the canvas coordinate space the highest position has a Y-coordinate of zero and as the number increases the position maps to a position further down on a page. There’s more than one way to address this, but since the linear transfor object can already handle this if I
specify the values in a certain order that’s the solution that I used.
The function made for public use on this class ia named plot. It accepts a list of functions to be graphed. While I expect an array of functions to be passed to it if a singular function were passed that’s converted to an array of one function so that it can be treated the same way. The plot function interates through the functions passed through it passing each one to another function that does the actual work. A different color index is passed for each function.
The real work is done in plotFunction. First the X-values that fall within the range of the limits of the graph are passed to the function being mapped and the canvas-mapped result is saved to an array. The result for each X-value could either be a number or a non-number. Non-numbers will not be represented in the graph. This allows for the generation of graphs for which there may be X-values that are not part of the functions domain. If an exception occurs when calling the function being graphed the X-value association with that exception is treated as a value for which the function returns nothing. After this first pass we have an array of the canvas-mapped output values from the function.
Rendering the Graph
Next we perform the acual rendering of the output onto the graph. The function will scan ahead in the array of results to the first numerical value. This first numerical value may or may not be in the first position of the array. Once a value is found it is used as the first coordinate for a line segment. Each numerical value in the array that follows this is added to the line segment. This continues until either the end of the array is reached or a non-numerical value is encountered. In either case the accumulated points for the line segment are stroked ending. If there are more values within the array the process is repeated until the end of the array is encountered.
function graph(context, options) {
	this.ctx = context;
	this.options = options;
	this.xMapping = new linearMapping(options.minX, options.maxX, 0, options.width);
	this.yMapping = new linearMapping(options.minY, options.maxY, options.height, 0);

	this.plot = function(sourceFunctions) {
		if(!Array.isArray(sourceFunctions))
			sourceFunctions = [sourceFunctions];
		var colorNumber = 0;
		sourceFunctions.forEach((x)=> {
			this.plotFunction(x,colorNumber);
			++colorNumber;
		})
	}

	this.plotFunction = function (plotFunction, colorNumber) {
		colorNumber = colorNumber || 0;
		colorNumber = colorNumber % this.options.dataColors.length;
		var values = new Array(this.options.width);
		for(var xPos=0;xPos<this.options.width;++xPos) {
			var y = null;
			var x= this.xMapping.rmap(xPos);
			try {
				values[xPos] = this.yMapping.map(plotFunction(x))
			} catch(exc) {
				values[xPos] = null;
			}
		}
		//Find the first value that we can map
		var xPos = 0;
		while((typeof values[xPos] != 'number')&&(!Array.isArray(values[xPos]))&&(xPos < values.length))
			++xPos;
		if(xPos == values.length)
			return;

		while(xPos<values.length) {
			this.ctx.beginPath();
			this.ctx.strokeStyle = this.options.dataColors[colorNumber];
			this.ctx.moveTo(xPos, values[xPos]);
			while(xPos+1<values.length && typeof values[xPos+1] == 'number') {
				++xPos;
				this.ctx.lineTo(xPos, values[xPos]);
			}
			++xPos;
			this.ctx.stroke();
			while((typeof values[xPos] != 'number')&&(xPos < values.length))
				++xPos;
		}
	}
}
How Does it Look?
The graphing class is complete. Showing a graph is now only a matter of including the JavaScript in a page and using it. The simplest example of using it would be the following.
var g = makeGraph(randomPlotsArea, options);
g.plot((x)=>{return Math.sin(x); });
Here’s the result!

I’ve made a page with a few place holders for graphs. Among other things it contains the following.
<p id="randomPlots">
	Random plots
</p>

<p id="trajectoryPlotArea" >
	Plot of a trajectory height for an object thrown up at 10 m/s near the earth's surface.
</p>
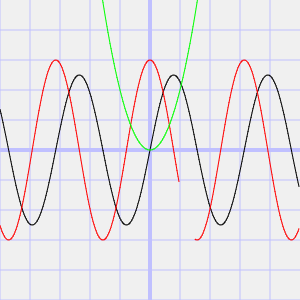
To render the graphs within their appropriate places I acquire a reference to the parent element in which the graph will be contained and I pass that to the makeGraph() function. Here I render the SIN function, the COSINE function (with no values returned from 2.0 to 3.0), and a x-squared
var randomPlotsArea = document.getElementById('randomPlots');
var options = new graphOptions();
var g = makeGraph(randomPlotsArea, options);
g.plot([
	function(x){return 5*Math.sin(x);},
	(x)=>{
			if(Math.floor(x)!=2)
				return 6 * Math.cos(x);
			return null;
		},
	(x)=>{return x * x; }
	]);
Here is the result. The range for which no value is returned is apparent from the area in which the red line on the graph is not rendered.

Where to From Here?
Awesome! The code works! But now what? Well, nothing for now. This was something I wrote with temporary intentions and to keep myself from being bored. That’s not to say that I’m giving up on developing a graphing library. Once back home I checked online to see what types of other graphing libraries are available. There’s a number of them, each having their own strengths. I have a direction in which I’d like to take this that is different from the others that are out there. I may revisit this, but only after a lot more thought of what I want to do, how I want this to work, and how the variations on graphs can be specified.